Reports
Effortless Event Management for Any Event Type
Reports
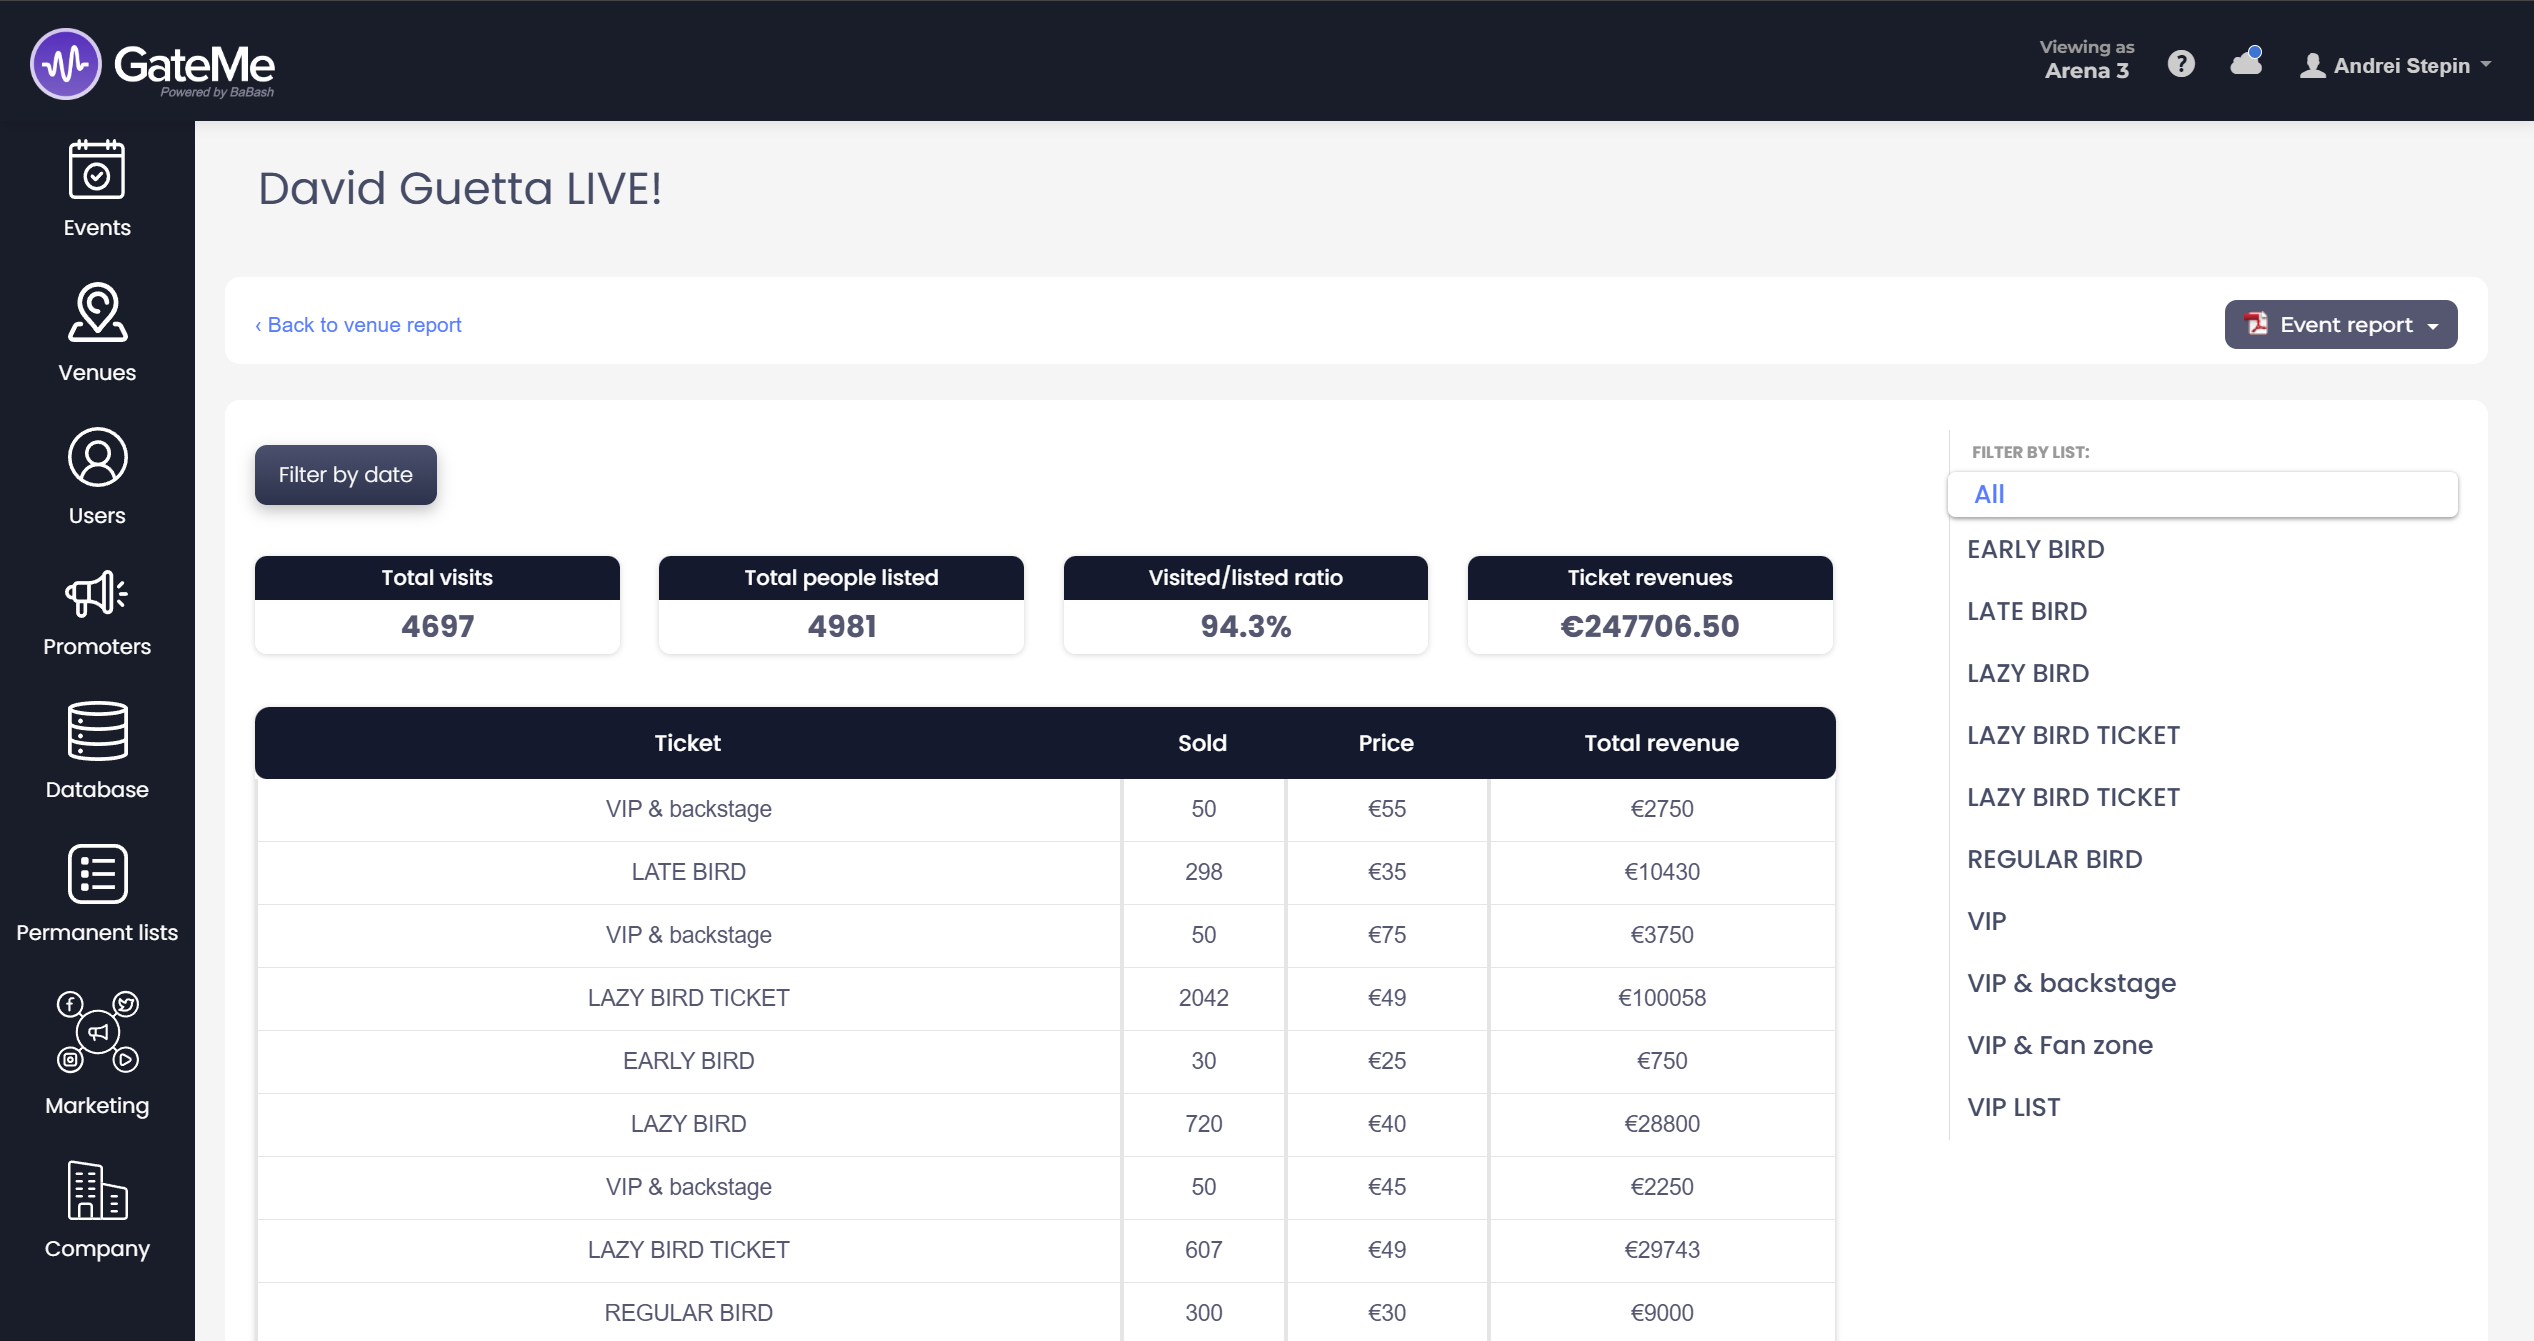
The “Reports” page in GateMe gives event organizers a detailed overview of their event’s performance. You’ll find it under the “Reports” section of your event dashboard.
🧾 What does the Reports page show?
The Reports page includes:
-
Ticket sales breakdown – revenue, ticket types sold, pricing, and volume
-
Visit stats – total visits, listed guests, and visit-to-list ratio
-
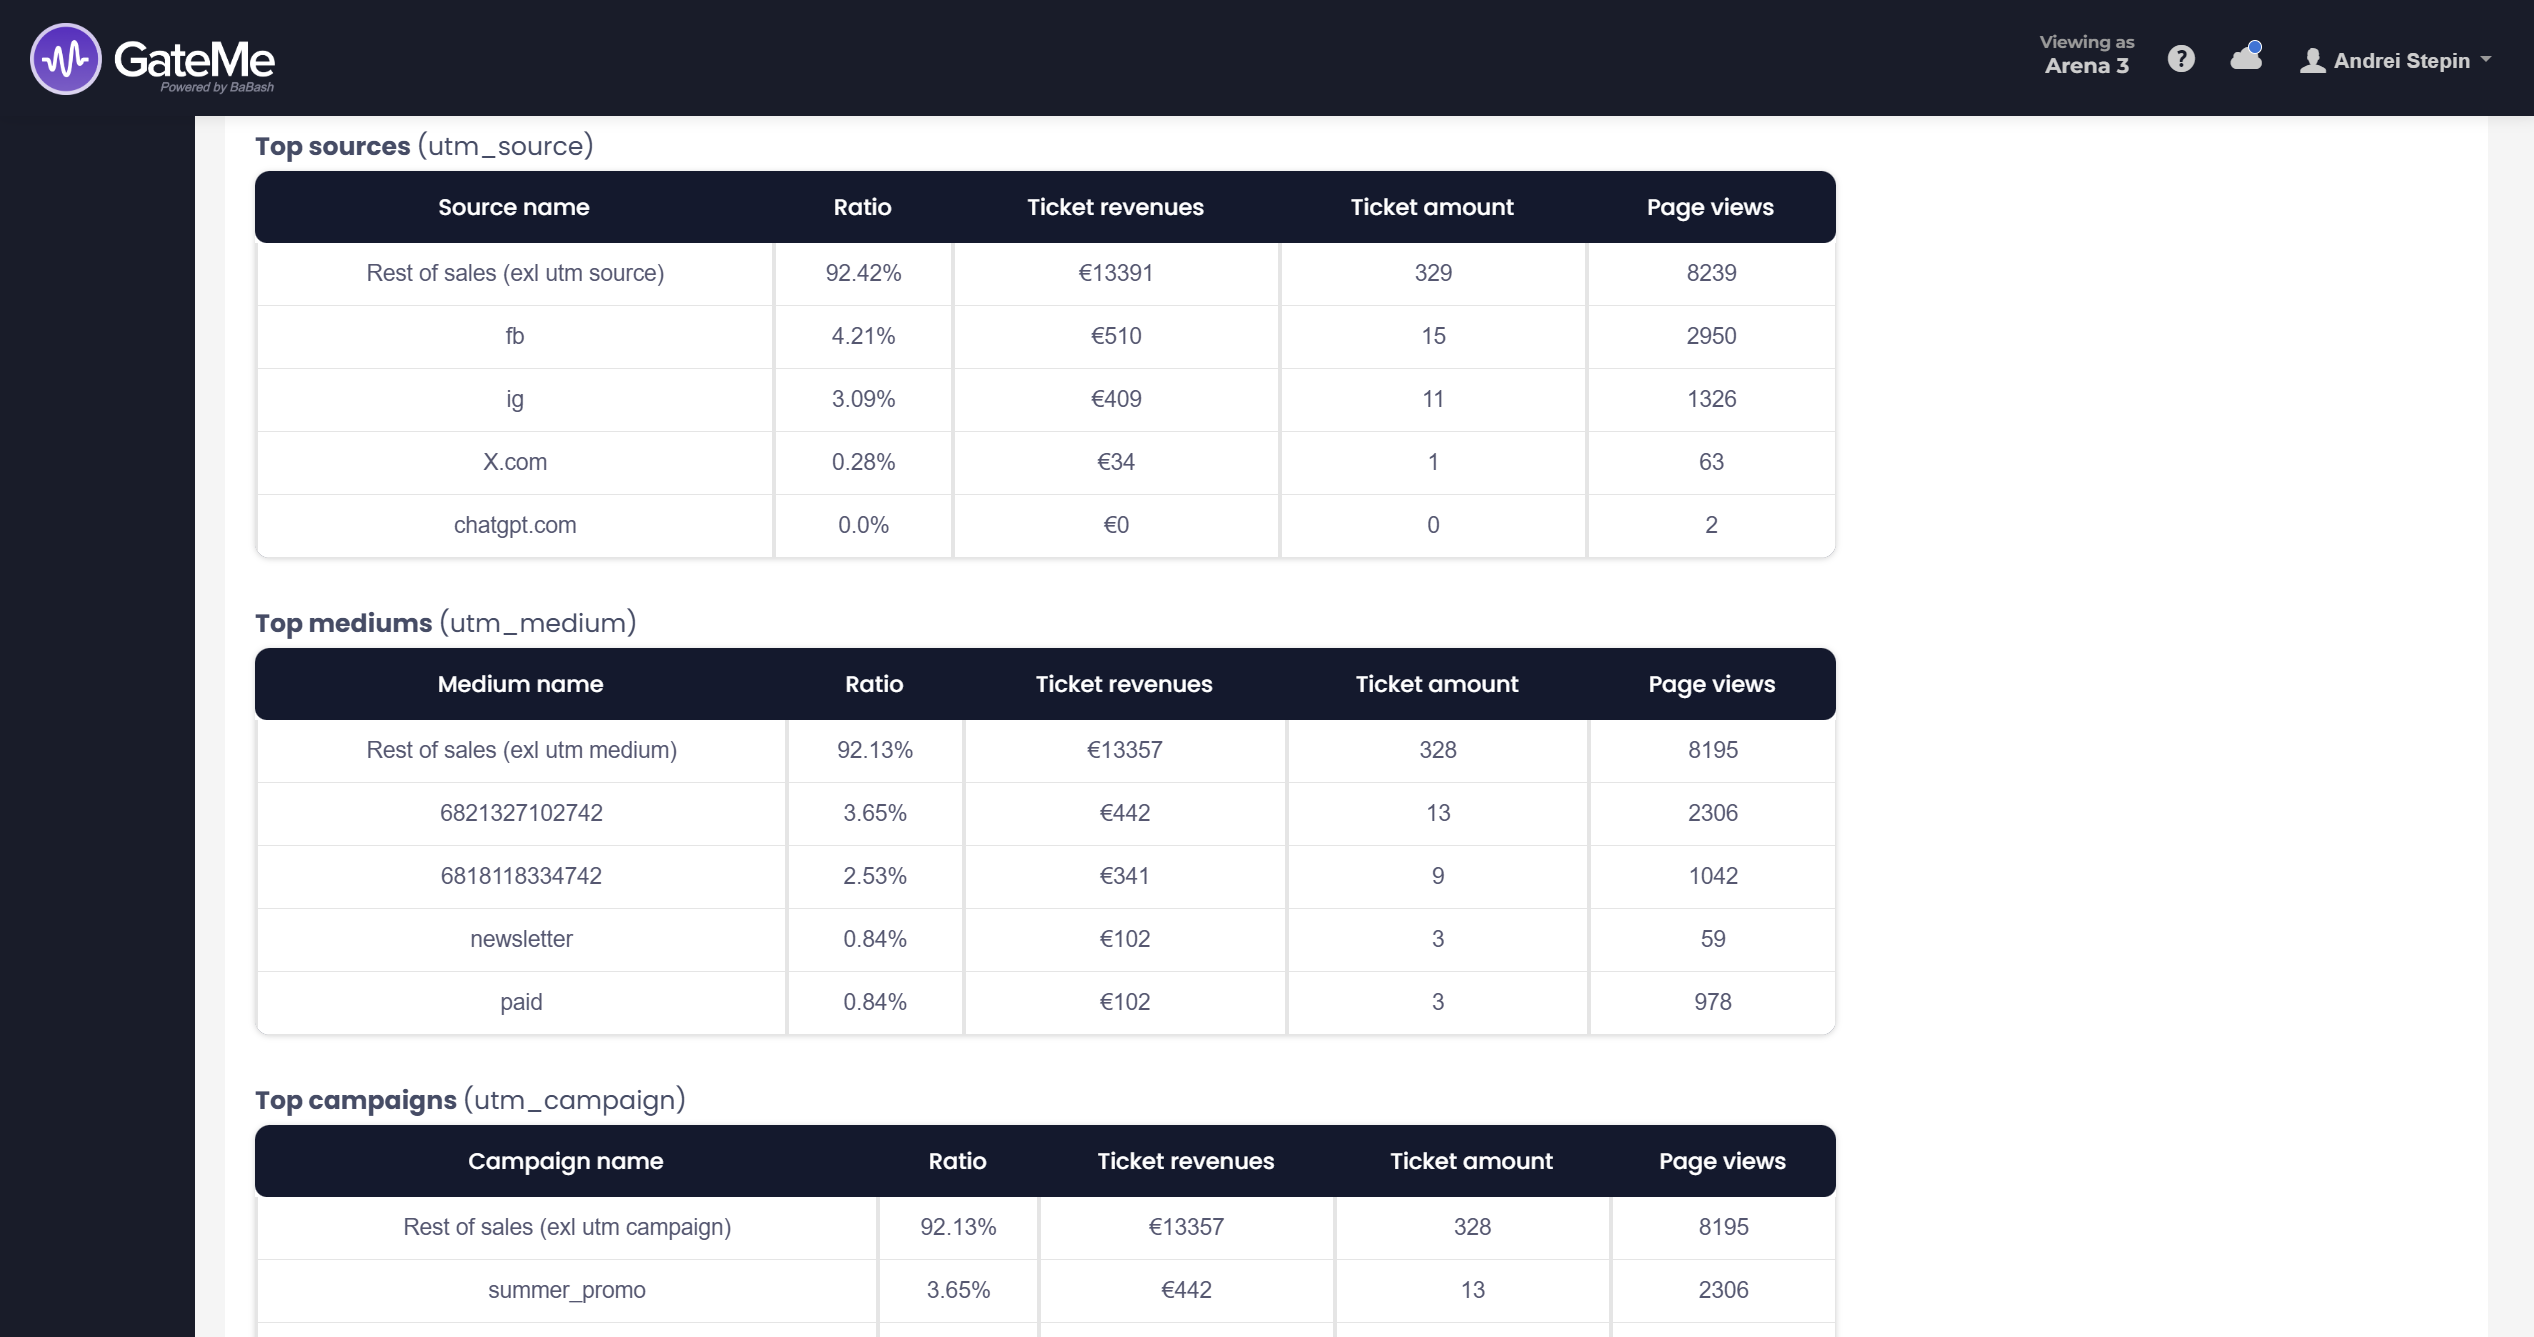
Sales analytics – segmented by source (
utm_source), medium (utm_medium), campaign (utm_campaign), keywords (utm_term) and contents (utm_content) -
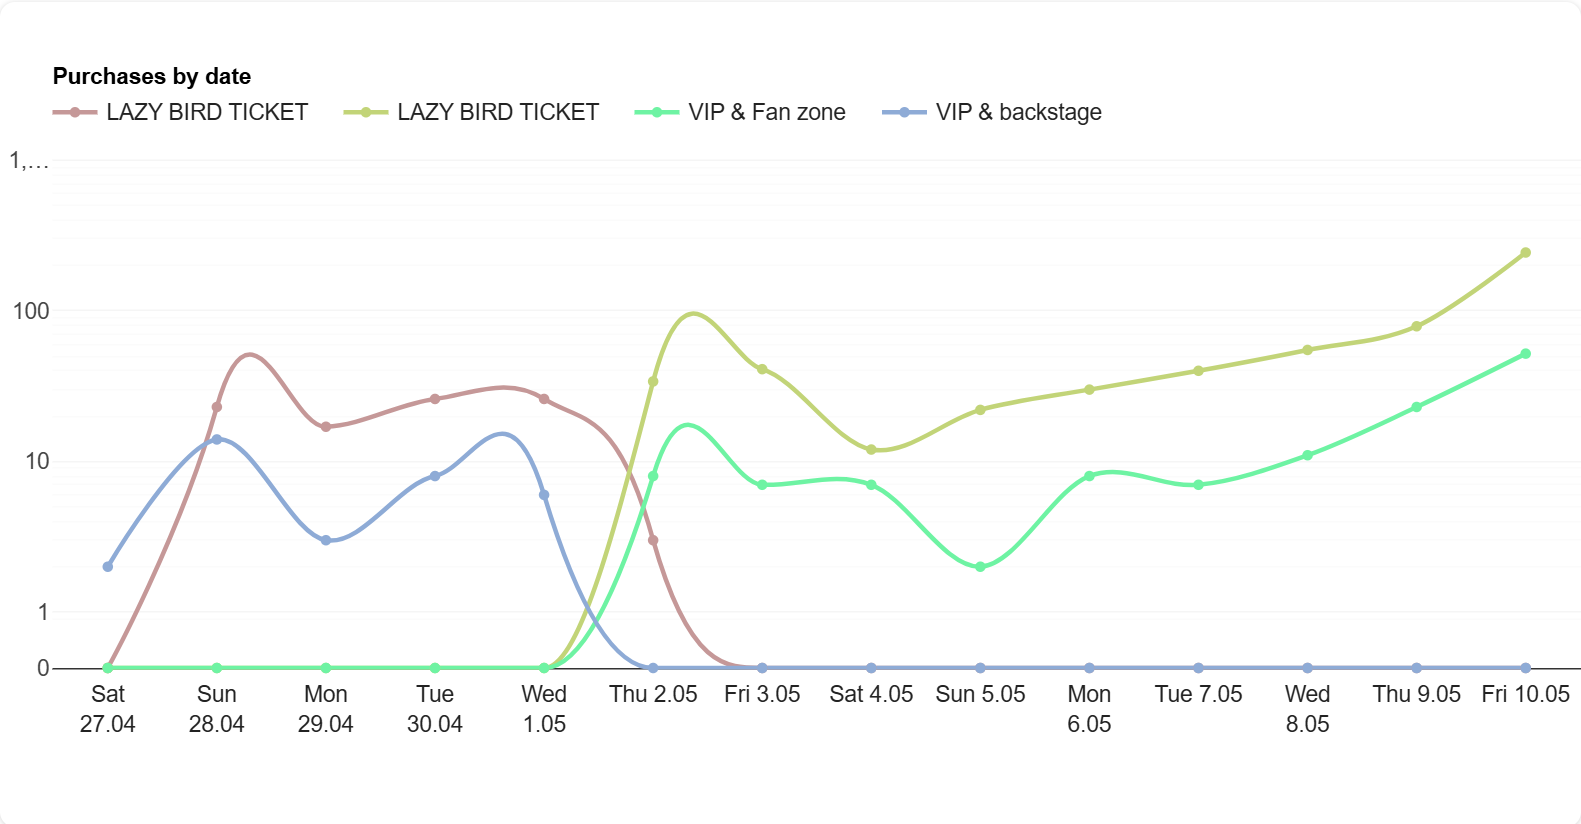
Traffic timelines – visits and ticket purchases visualized over time
📈 Meta Ads & Campaign Tracking
If you are running Meta (Facebook/Instagram) ads, GateMe automatically tracks traffic and conversion performance via Meta’s URL parameters — no manual tagging needed.
To activate this:
-
Navigate to the “Marketing” tab in your dashboard’s left menu.
-
Enter your Google Analytics 4 ID, Meta Pixel ID, and Google Tag Manager ID.
-
Save your settings.
Once the Meta Pixel ID is added, GateMe will detect campaign parameters from ad traffic and show relevant sales performance directly within the Reports page — under the UTM sources, mediums, and campaigns.
This allows you to compare which channels and ads are generating the most views, ticket purchases, and revenue, all in one place.
📅 How to filter and use this data
-
Use filters by date, ticket list, or campaign type to drill into specific performance data.
-
Visual graphs show traffic peaks and purchase trends, helping you optimize promo timing.
For Event Organizers
Event Creation
Marketing Tools
Reports
Payouts
Marketing&Tracking
Promote Event
Promoters
Seated Tickets
Promo Codes
Permanent Lists
Additional Questions
Check-In Guests
Staff&Users
Free Tickets
Refunds
Database
Guest Lists
For Ticket Buyers
Recover Your Tickets


